Experiments: The Gold Standard of Evidence-Based Management
Posted: 12/06/2020


Randomised Controlled Trials are the definitive test of a commercial strategy or tactic. Data science might identify potential effects. But it doesn’t detect causality and therefore by definition, will always over-state the opportunity by an unknown amount.
Experiments, or randomised controlled trials (RCTs), are the scientific gold standard. Dating back to 1747 and James Lind’s discovery that lemons cure scurvy, RCTs are now a regulatory requirement in medicine and standard practice across the biological and social sciences. Their great merit is that they definitively prove whether an action, like administering a new drug, has any effect and, if it does, the size of that effect.
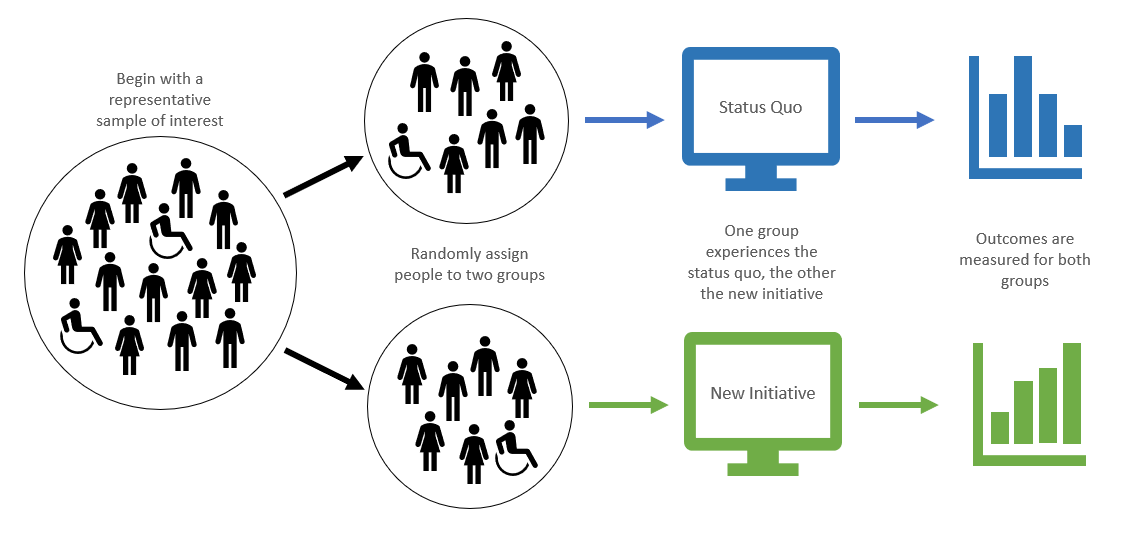
As shown in the figure, RCTs achieve this by randomly allocating participants into groups. One group, the control, continues to be treated as before. Other groups experience alternative treatments, in Lind’s case this included lemon juice supplements, cider, vinegar and diluted sulphuric acid (!). Outcomes of interest are then recorded for all the groups and compared statistically. After five days, the lemon juiced sailors had recovered whilst the control and other test groups were still ill.
Figure 1: Overview of an Experiment
Over-estimating the real-world impact of a strategy is a common commercial disappointment. This is because businesses often rely on the correlative statistics used by data scientists, where causation is unclear. For example, do sales really go up when you do more advertising? Or does the brand team spend more on advertising when there’s additional sales to be had? In both cases, a link between sales and ad spend would be observed in a time series model. But only in the first case will a strategy of spending more on advertising yield increased sales.
We’ve discussed why ‘correlation isn’t causation’ in other posts (e.g. here). It means that the size of any effect measured with data science techniques always turns out muted in practice. A retention analysis might show that people who use a feature are less likely to churn. But cajoling non-adopters to use this feature is very different from noticing that un-incentivised super-users are more loyal, which is what caused the original correlation.
RCTs don’t suffer from this problem because they conclusively establish the causal relationship between an innovation and an outcome. The random allocation of participants means that the change tested in a treatment group, relative to the control, is the only thing that’s different. So that change must be what caused any observed shift in outcomes.
Returning to the churn example, before declaring victory and implementing a large-scale feature activation programme, the firm should run a churn reduction A/B test. This would observe churn for a control group in parallel with other treatments where, informed by the data science, we attempt to incentivise feature usage or, indeed, any other activity we think may cost-effectively reduce churn. Only in this way can we precisely measure each strategy’s effect and manage the business based on that evidence. This allows us to avoid costly mistakes or failures and, conversely, channel our limited resources into the highest yield activities.
Get in Touch if you would like to find out more.